Found 5 results for "docuburst":
 1264 1264 | 2006 Java by Christopher Collins
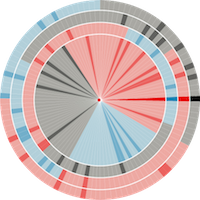
DocuBurst is the first visualization of document content which takes advantage of the human-created structure in lexical databases. We use an accepted design paradigm to generate visualizations which improve the usability and utility of WordNet as the backbone for document content visualization. A radial, space-filling layout of hyponymy (IS-A relation) is presented with interactive techniques of zoom, filter, and details-on-demand for the task of document visualization. The techniques can be generalized to multiple documents.
This image shows the occurrences of "idea" words in a general science textbook. The opacity of the node fill colour corresponds to the strength of occurrence of related terms in the target text. The graph structure is the WordNet hyponymy graph, rooted at "idea", and the gold coloured nodes match a search query for words starting with "pl".
|
 1266 1266 | 2006 Java by Christopher Collins
DocuBurst is the first visualization of document content which takes advantage of the human-created structure in lexical databases. We use an accepted design paradigm to generate visualizations which improve the usability and utility of WordNet as the backbone for document content visualization. A radial, space-filling layout of hyponymy (IS-A relation) is presented with interactive techniques of zoom, filter, and details-on-demand for the task of document visualization. The techniques can be generalized to multiple documents.
This image shows a DocuBurst graph rooted at "atmospheric phenomenon". Node opacity is directly related to the occurrences of related terms in the target text. The graph structure is the WordNet hyponymy tree. Gold coloured nodes are search results for words that start with "w". Blue nodes trace the path from the node under the mouse ("light") to the graph's root.
|
 1267 1267 | 2006 Java by Christopher Collins
DocuBurst is the first visualization of document content which takes advantage of the human-created structure in lexical databases. We use an accepted design paradigm to generate visualizations which improve the usability and utility of WordNet as the backbone for document content visualization. A radial, space-filling layout of hyponymy (IS-A relation) is presented with interactive techniques of zoom, filter, and details-on-demand for the task of document visualization. The techniques can be generalized to multiple documents.
The subtree rooted at "radiation" is "rolled up" using the mouse wheel, to allow other nodes to expand their angular extent.
|
 1268 1268 | 2006 Java by Christopher Collins
DocuBurst is the first visualization of document content which takes advantage of the human-created structure in lexical databases. We use an accepted design paradigm to generate visualizations which improve the usability and utility of WordNet as the backbone for document content visualization. A radial, space-filling layout of hyponymy (IS-A relation) is presented with interactive techniques of zoom, filter, and details-on-demand for the task of document visualization. The techniques can be generalized to multiple documents.
In this DocuBurst graph, occurrences of words in the document of interest (a science textbook) is indicated by increased opacity of the corresponding graph node. The graph structure is the WordNet hyponymy tree. Here, we can see that "kind" and "quantity" occur more often than "feature" and "idea", while "concept" does not occur at all.
|
 1265 1265 | 2006 Java by Christopher Collins
DocuBurst is the first visualization of document content which takes advantage of the human-created structure in lexical databases. We use an accepted design paradigm to generate visualizations which improve the usability and utility of WordNet as the backbone for document content visualization. A radial, space-filling layout of hyponymy (IS-A relation) is presented with interactive techniques of zoom, filter, and details-on-demand for the task of document visualization. The techniques can be generalized to multiple documents.
This image shows the DocuBurst interface. A note in the main graph is selected, and all occurrences of words corresponding to that node are highlighted in orange in the document browser on the right. The bottom panel highlights occurrences of the selected words in the original text.
|

